Difference between revisions of "Fancy Plots using Plotly"
m (Text reformatting) (Tag: Visual edit) |
m (Added Dataframe code) (Tag: Visual edit) |
||
| Line 109: | Line 109: | ||
[[File:Cat vs dog cuteness.png|frameless|733x733px]] | [[File:Cat vs dog cuteness.png|frameless|733x733px]] | ||
| + | |||
| + | ==== Creating DataFrame from Arrays ==== | ||
| + | <syntaxhighlight lang="py"> | ||
| + | TOTAL_NUMBERS = 1000 | ||
| + | y = np.zeros(TOTAL_NUMBERS) | ||
| + | x = np.zeros(TOTAL_NUMBERS) | ||
| + | df = pd.DataFrame(data={"X_Label": x, "Y_Label": y}) | ||
| + | </syntaxhighlight> | ||
==Scatter Plots== | ==Scatter Plots== | ||
Latest revision as of 14:47, 15 March 2022
Plotly in a nutshell: elegant plots for adding in to research papers. |
- This is a collection of simple plots using the plotly library.
- It consists of elegant color schemes and easy to ready adjustable fonts.
- The reason for using plotly is that it allows for HTML plots that can be scaled and zoomed after plotting.
Contents
Installation
We need the plotly-express and kaleido library.
Conda
conda install -c plotly plotly_express==0.4.0
conda install -c conda-forge python-kaleido
Pip
pip install plotly_express==0.4.0
pip install kaleido
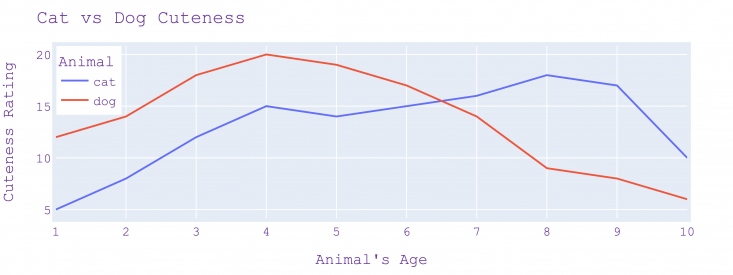
Line Plots
CSV Data
animal,age,cuteness
cat,1,5
cat,2,8
cat,3,12
cat,4,15
cat,5,14
cat,6,15
cat,7,16
cat,8,18
cat,9,17
cat,10,10
dog,1,12
dog,2,14
dog,3,18
dog,4,20
dog,5,19
dog,6,17
dog,7,14
dog,8,9
dog,9,8
dog,10,6
Code
import plotly.express as px
import pandas as pd
from tqdm import tqdm

PLOTS_DIR = "./plots"
PLOT_NAME = "cat_v_dog"
PLOT_TYPES = ["svg", "png", "html", "pdf", "jpeg"]
FIG_DIR = PLOTS_DIR + "/" + PLOT_NAME
!mkdir -p $FIG_DIR

# Plot Size
PLOT_WIDTH = 800
PLOT_HEIGHT = 300


df = pd.read_csv('./data/sample.csv')
fig = px.line(df, x="age", y="cuteness", color="animal")
fig.update_layout(
    title="Cat vs Dog Cuteness",
    xaxis_title="Animal's Age",
    yaxis_title="Cuteness Rating",
    legend_title="Animal",
    font=dict(
        family="Courier New, monospace",
        size=14,
        color="RebeccaPurple"
    )
)

fig.update_layout(
    autosize=True,
    width=PLOT_WIDTH,
    height=PLOT_HEIGHT,
    margin=dict(
        l=50,
        r=50,
        b=50,
        t=50,
        pad=4
    ),
    legend=dict(
        yanchor="top",
        y=0.999,
        xanchor="left",
        x=0.001)
)

fig.show()
# Save Plot
for i in tqdm(range(len(PLOT_TYPES))):
    if PLOT_TYPES[i] == "html":
        fig.write_html(FIG_DIR + "/" + PLOT_NAME + "." + PLOT_TYPES[i])
    else:
        fig.write_image(FIG_DIR + "/" + PLOT_NAME + "." + PLOT_TYPES[i], scale=5)
Output
Creating DataFrame from Arrays
TOTAL_NUMBERS = 1000
y = np.zeros(TOTAL_NUMBERS)
x = np.zeros(TOTAL_NUMBERS)
df = pd.DataFrame(data={"X_Label": x, "Y_Label": y})
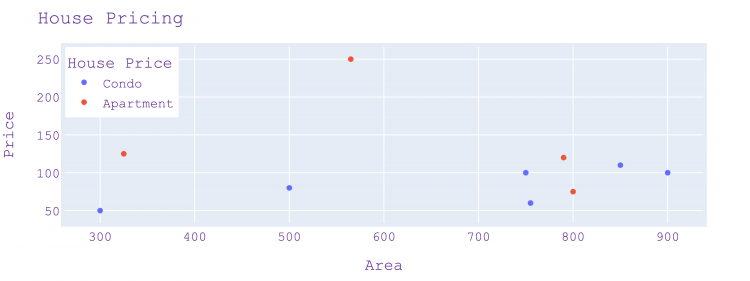
Scatter Plots
CSV Data
type,area,price
Condo,900,100
Apartment,565,250
Condo,500,80
Apartment,800,75
Condo,750,100
Condo,850,110
Apartment,790,120
Condo,755,60
Apartment,325,125
Condo,300,50
Code
import plotly.express as px
import pandas as pd
from tqdm import tqdm

PLOTS_DIR = "./plots"
PLOT_NAME = "house_price"
PLOT_TYPES = ["svg", "png", "html", "pdf", "jpeg"]
FIG_DIR = PLOTS_DIR + "/" + PLOT_NAME
!mkdir -p $FIG_DIR

# Plot Size
PLOT_WIDTH = 800
PLOT_HEIGHT = 300


df = pd.read_csv('./data/scatter.csv')
fig = px.scatter(df, x="area", y="price", color="type")


fig.update_layout(
    title="House Pricing",
    xaxis_title="Area",
    yaxis_title="Price",
    legend_title="House Price",
    font=dict(
        family="Courier New, monospace",
        size=14,
        color="RebeccaPurple"
    )
)

fig.update_layout(
    autosize=True,
    width=PLOT_WIDTH,
    height=PLOT_HEIGHT,
    margin=dict(
        l=50,
        r=50,
        b=50,
        t=50,
        pad=4
    ),
    legend=dict(
        yanchor="top",
        y=0.999,
        xanchor="left",
        x=0.001)
)
fig.show()
# Save Plot
for i in tqdm(range(len(PLOT_TYPES))):
    if PLOT_TYPES[i] == "html":
        fig.write_html(FIG_DIR + "/" + PLOT_NAME + "." + PLOT_TYPES[i])
    else:
        fig.write_image(FIG_DIR + "/" + PLOT_NAME + "." + PLOT_TYPES[i], scale=5)
Output
Bar Plots
CSV Data
Code
Output
Radar Plots
CSV Data
Code
Output
Pie Charts
CSV Data
Code
Output
Bubble Charts
CSV Data
Code
Output
Box Plots
CSV Data
Code
Output
2D Histograms
CSV Data
Code
Output

