You are viewing an old version of this page. Return to the latest version.
Difference between revisions of "Fancy Plots using Plotly"
m (Space syntax test) (Tag: Visual edit) |
m (Test py syntax) (Tag: Visual edit) |
||
| Line 157: | Line 157: | ||
fig.write_image(FIG_DIR + "/" + PLOT_NAME + "." + PLOT_TYPES[i], scale=5) | fig.write_image(FIG_DIR + "/" + PLOT_NAME + "." + PLOT_TYPES[i], scale=5) | ||
</syntaxhighlight> | </syntaxhighlight> | ||
| + | <br /><syntaxhighlight lang="py" line="1"> | ||
| + | import plotly.express as px | ||
| + | import pandas as pd | ||
| + | from tqdm import tqdm | ||
| + | PLOTS_DIR = "./plots" | ||
| + | PLOT_NAME = "cat_v_dog" | ||
| + | PLOT_TYPES = ["svg", "png", "html", "pdf", "jpeg"] | ||
| + | FIG_DIR = PLOTS_DIR + "/" + PLOT_NAME | ||
| + | !mkdir -p $FIG_DIR | ||
| + | |||
| + | # Plot Size | ||
| + | PLOT_WIDTH = 800 | ||
| + | PLOT_HEIGHT = 300 | ||
| + | |||
| + | |||
| + | df = pd.read_csv('./data/sample.csv') | ||
| + | fig = px.line(df, x="age", y="cuteness", color="animal") | ||
| + | fig.update_layout( | ||
| + | title="Cat vs Dog Cuteness", | ||
| + | xaxis_title="Animal's Age", | ||
| + | yaxis_title="Cuteness Rating", | ||
| + | legend_title="Animal", | ||
| + | font=dict( | ||
| + | family="Courier New, monospace", | ||
| + | size=14, | ||
| + | color="RebeccaPurple" | ||
| + | ) | ||
| + | ) | ||
| + | |||
| + | fig.update_layout( | ||
| + | autosize=True, | ||
| + | width=PLOT_WIDTH, | ||
| + | height=PLOT_HEIGHT, | ||
| + | margin=dict( | ||
| + | l=50, | ||
| + | r=50, | ||
| + | b=50, | ||
| + | t=50, | ||
| + | pad=4 | ||
| + | ), | ||
| + | legend=dict( | ||
| + | yanchor="top", | ||
| + | y=0.999, | ||
| + | xanchor="left", | ||
| + | x=0.001) | ||
| + | ) | ||
| + | |||
| + | fig.show() | ||
| + | # Save Plot | ||
| + | for i in tqdm(range(len(PLOT_TYPES))): | ||
| + | if PLOT_TYPES[i] == "html": | ||
| + | fig.write_html(FIG_DIR + "/" + PLOT_NAME + "." + PLOT_TYPES[i]) | ||
| + | else: | ||
| + | fig.write_image(FIG_DIR + "/" + PLOT_NAME + "." + PLOT_TYPES[i], scale=5) | ||
| + | </syntaxhighlight> | ||
Revision as of 12:58, 18 February 2022
in a nutshell: elegant plots for adding in to research papers. |
- This is a collection of simple plots using the plotly library.
- It consists of elegant color schemes and easy to ready adjustable fonts.
- The reason for using plotly is that it allows for HTML plots that can be scaled and zoomed after plotting.
Contents
Installation
We need the plotly-express and kaleido library.
Conda
conda install -c plotly plotly_express==0.4.0
conda install -c conda-forge python-kaleido
Pip
pip install plotly_express==0.4.0
pip install kaleido
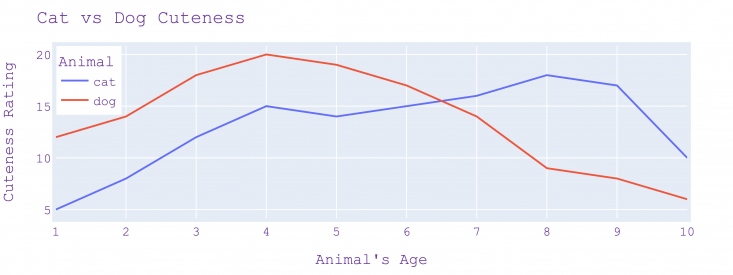
Line Plots
CSV Data:
animal,age,cuteness
cat,1,5
cat,2,8
cat,3,12
cat,4,15
cat,5,14
cat,6,15
cat,7,16
cat,8,18
cat,9,17
cat,10,10
dog,1,12
dog,2,14
dog,3,18
dog,4,20
dog,5,19
dog,6,17
dog,7,14
dog,8,9
dog,9,8
dog,10,6
Code:
import plotly.express as pximport pandas as pd from tqdm import tqdm
PLOTS_DIR = "./plots" PLOT_NAME = "cat_v_dog" PLOT_TYPES = ["svg", "png", "html", "pdf", "jpeg"] FIG_DIR = PLOTS_DIR + "/" + PLOT_NAME !mkdir -p $FIG_DIR
- Plot Size
PLOT_WIDTH = 800 PLOT_HEIGHT = 300
df = pd.read_csv('./data/sample.csv') fig = px.line(df, x="age", y="cuteness", color="animal") fig.update_layout(title="Cat vs Dog Cuteness", xaxis_title="Animal's Age", yaxis_title="Cuteness Rating", legend_title="Animal", font=dict( family="Courier New, monospace", size=14, color="RebeccaPurple" ))
fig.update_layout(
autosize=True, width=PLOT_WIDTH, height=PLOT_HEIGHT, margin=dict( l=50, r=50, b=50, t=50, pad=4 ), legend=dict( yanchor="top", y=0.999, xanchor="left", x=0.001))
fig.show()
- Save Plot
for i in tqdm(range(len(PLOT_TYPES))):
if PLOT_TYPES[i] == "html": fig.write_html(FIG_DIR + "/" + PLOT_NAME + "." + PLOT_TYPES[i]) else:fig.write_image(FIG_DIR + "/" + PLOT_NAME + "." + PLOT_TYPES[i], scale=5)
import plotly.express as px
import pandas as pd
from tqdm import tqdm

PLOTS_DIR = "./plots"
PLOT_NAME = "cat_v_dog"
PLOT_TYPES = ["svg", "png", "html", "pdf", "jpeg"]
FIG_DIR = PLOTS_DIR + "/" + PLOT_NAME
!mkdir -p $FIG_DIR

# Plot Size
PLOT_WIDTH = 800
PLOT_HEIGHT = 300


df = pd.read_csv('./data/sample.csv')
fig = px.line(df, x="age", y="cuteness", color="animal")
fig.update_layout(
 title="Cat vs Dog Cuteness",
 xaxis_title="Animal's Age",
 yaxis_title="Cuteness Rating",
 legend_title="Animal",
 font=dict(
  family="Courier New, monospace",
  size=14,
  color="RebeccaPurple"
  )
)

fig.update_layout(
 autosize=True,
 width=PLOT_WIDTH,
 height=PLOT_HEIGHT,
 margin=dict(
  l=50,
  r=50,
  b=50,
  t=50,
  pad=4
  ),
  legend=dict(
  yanchor="top",
  y=0.999,
  xanchor="left",
  x=0.001)
)

fig.show()
# Save Plot
for i in tqdm(range(len(PLOT_TYPES))):
 if PLOT_TYPES[i] == "html":
  fig.write_html(FIG_DIR + "/" + PLOT_NAME + "." + PLOT_TYPES[i])
 else:
  fig.write_image(FIG_DIR + "/" + PLOT_NAME + "." + PLOT_TYPES[i], scale=5)
Output:
Scatter Plots
Bar Plots
Radar Plots
Bubble Charts
Box Plots
2D Histograms
